The full study can be accessed: Here
The final leaflet visualization can be seen: Here
Download the Python application for extracting twitter data: Here
This project is based on the premise of streamlining the collection and organization of twitter data for analysis through the use of various tools. Twitter data mentioning trump positively and negatively, regards to wall, health care and immigration was used for visualization and analysis purposes.
The objective for this project was to create a process for gathering, organizing, and visually displaying the data collected from Twitter. The search topic of choice for this project was Donald Trump and some of the topics with which he has controversial positions on; such as: immigration, the border wall with Mexico, healthcare, etc.
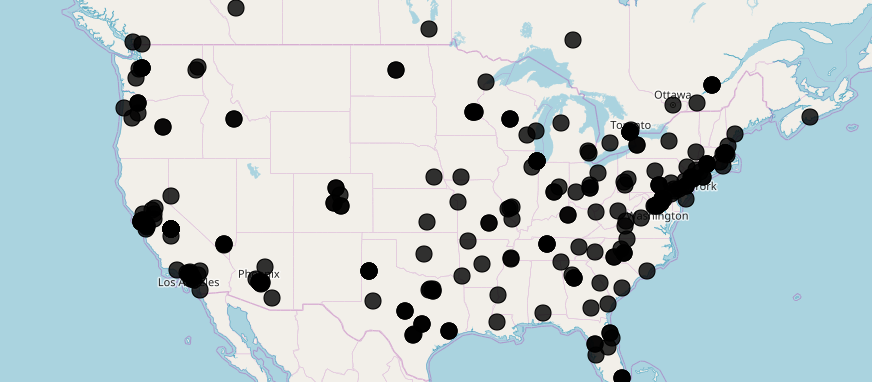
This projects has no general study area since it is a software that is used to extract twitter data. However, for the purpose of displaying Trump tweet data, only tweets from North America (Mostly USA) was used.
The visualization was accomplished in the leaflet application by clearly displaying the tweeters stand on the topic of the search queries. By filtering for any of the categories in the leaflet application, all the tweets regarding that topic can be seen with both positives and negative markers. By clicking on any one point, the tweet and location pops up in a short and concise menu. Future development on this topic would include the integration of tweet gathering and spatial data display all within 1 application. This will require dynamically generating an html file and the associated javascript code.